Infographics workshop
Sunday 1 October from 10:00 – 16:00
Workshop convener: Indi Hodgson-Johnston, Integrated Marine Observing System, University of Tasmania, Hobart, Tasmania
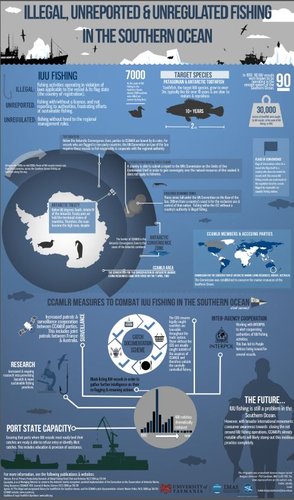
Infographics are a popular and effective way of communicating your research. From data visualisation to explaining a methodology, infographics assist in visually explaining and sharing complex scientific research to a broad audience.
This workshop intends to teach you the basics of infographic creation. It will take you through the initial steps of your research story, by defining who your audience is and what you want to tell them.
The next step identifies your ‘factoids’, the little snippets of information that tell a greater and engaging story, and hones the information into simple and clear language. Then the design process begins!
Using software of your choice (e.g. Adobe Illustrator, Inkscape, Powerpoint), we will cover concepts such as effective data visualisation, illustrations vs diagrams, basic graphic design concepts, fonts, citations, where to source graphics, basic image creation and so on. These skills have applications beyond infographics, and include conference posters and presentation slides.
Finally, we will cover the communication aspect. This will explain the best ways of communicating your design, through social media, internal communications, and presentations.
Follow up support from the convenor will be available following the workshop!
There is no additional charge for this workshop, but please tick the box to secure a place!

